Outage numbers for reporters
Storm outages this past week
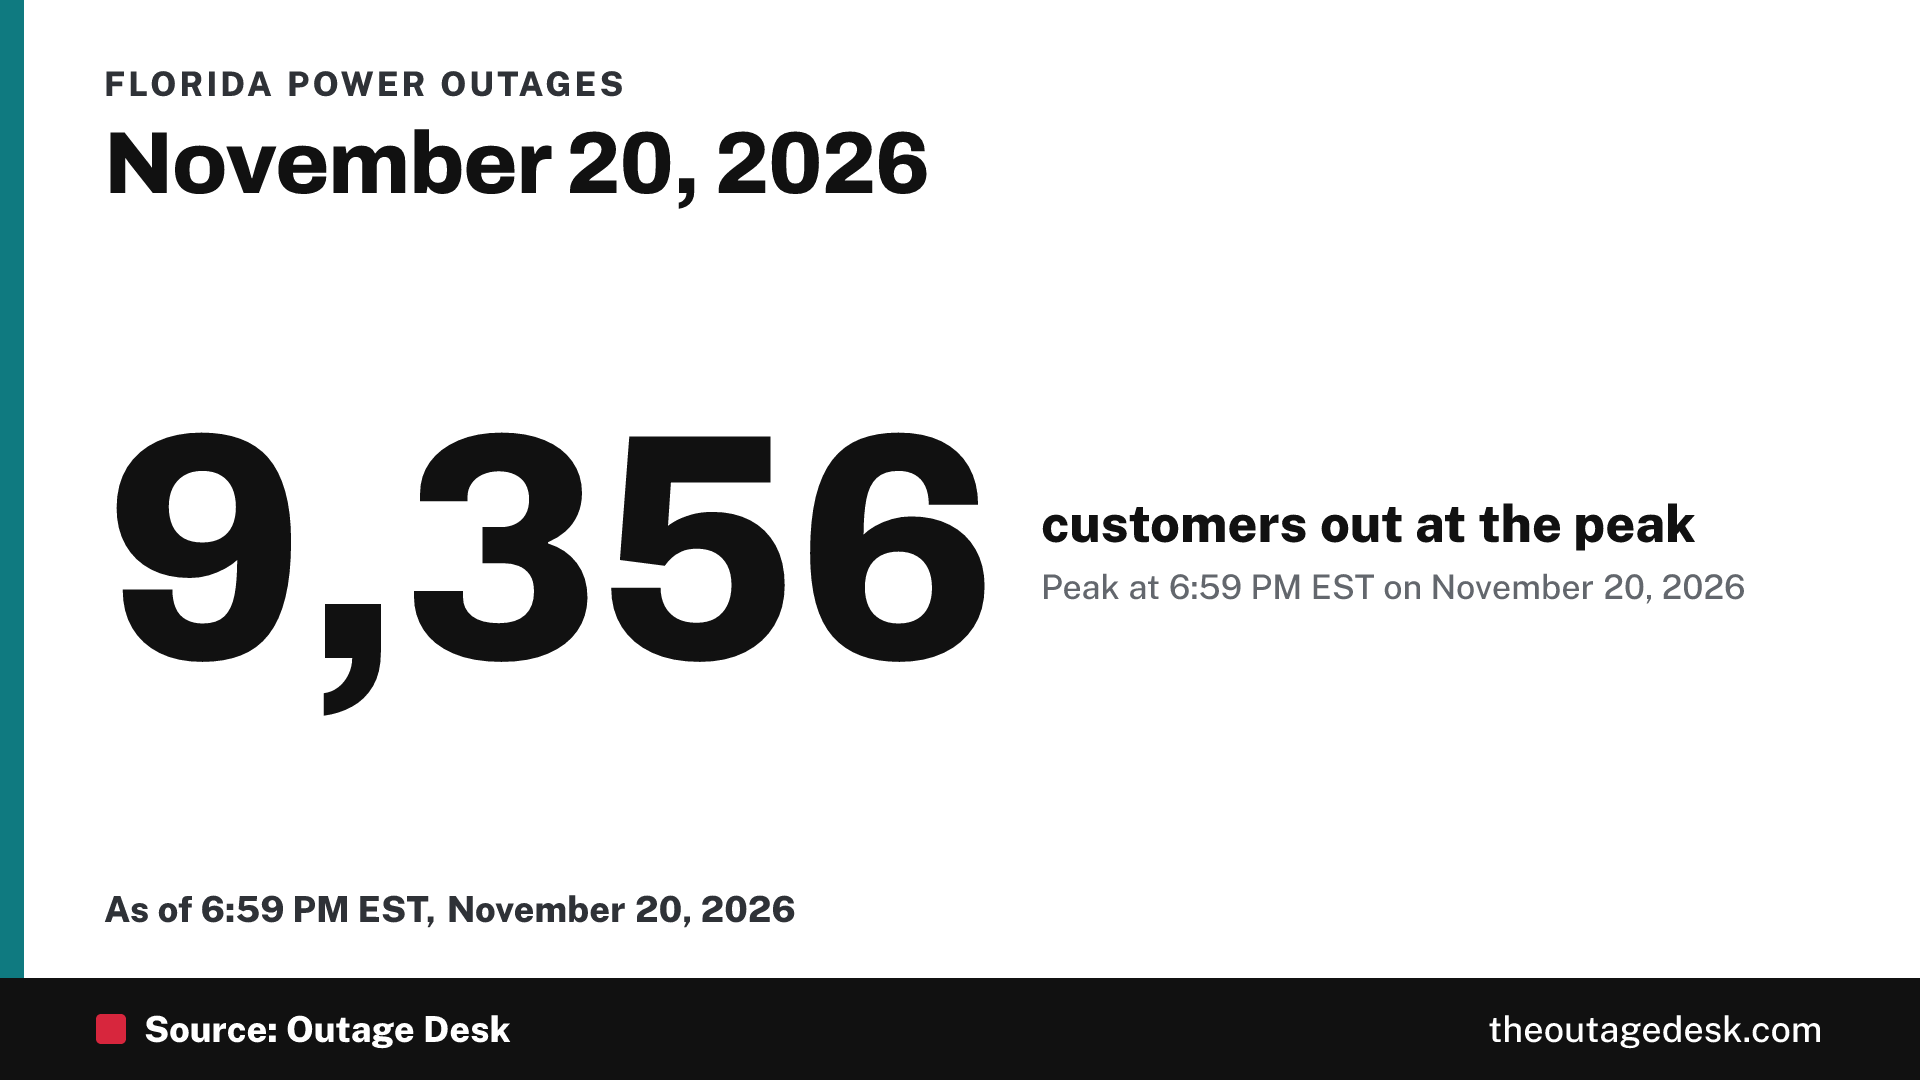
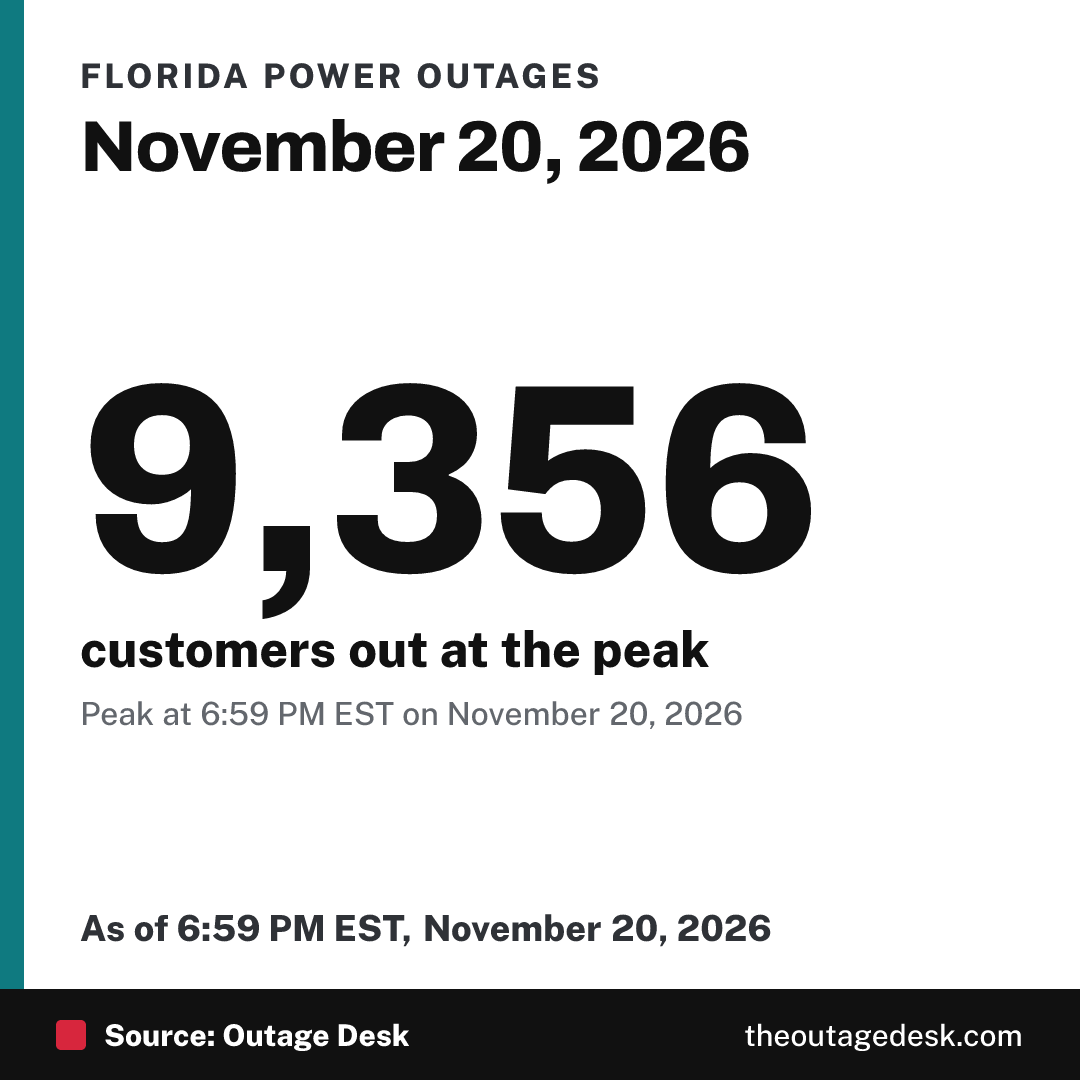
Florida Nov 20, 2026
RestoredHardest hit: Monroe County (peak 4,626), Volusia County (peak 3,539), Lee County (peak 2,558).
- Monroe County Restored Fri, Nov 20, 7:16 PM EST. Peak 4,626, out about 45 minutes.
- Volusia County, Florida Power & Light Restored Fri, Nov 20, 6:30 PM EST. Peak 3,444, out about 8 hours 45 minutes.
- Lee County Restored Fri, Nov 20, 8:57 AM EST. Peak 2,529, out about 15 minutes.
- Volusia County, Duke Energy Florida Restored Fri, Nov 20, 6:15 AM EST. Peak 2,316, out about 1 hour 15 minutes.
- Marion County Restored Fri, Nov 20, 8:29 PM EST. Peak 1,913, out about 1 hour 30 minutes.
All 24 outage timelines for this storm
Cite thisStorm outages in Florida peaked at 9,356 customers at 6:59 PM EST on November 20, 2026, according to Outage Desk (theoutagedesk.com/storms/florida-2026-11-20/).For reporters
Storm page · Graphic: wide or square · Embed a live box
Wisconsin Nov 19 to 20, 2026
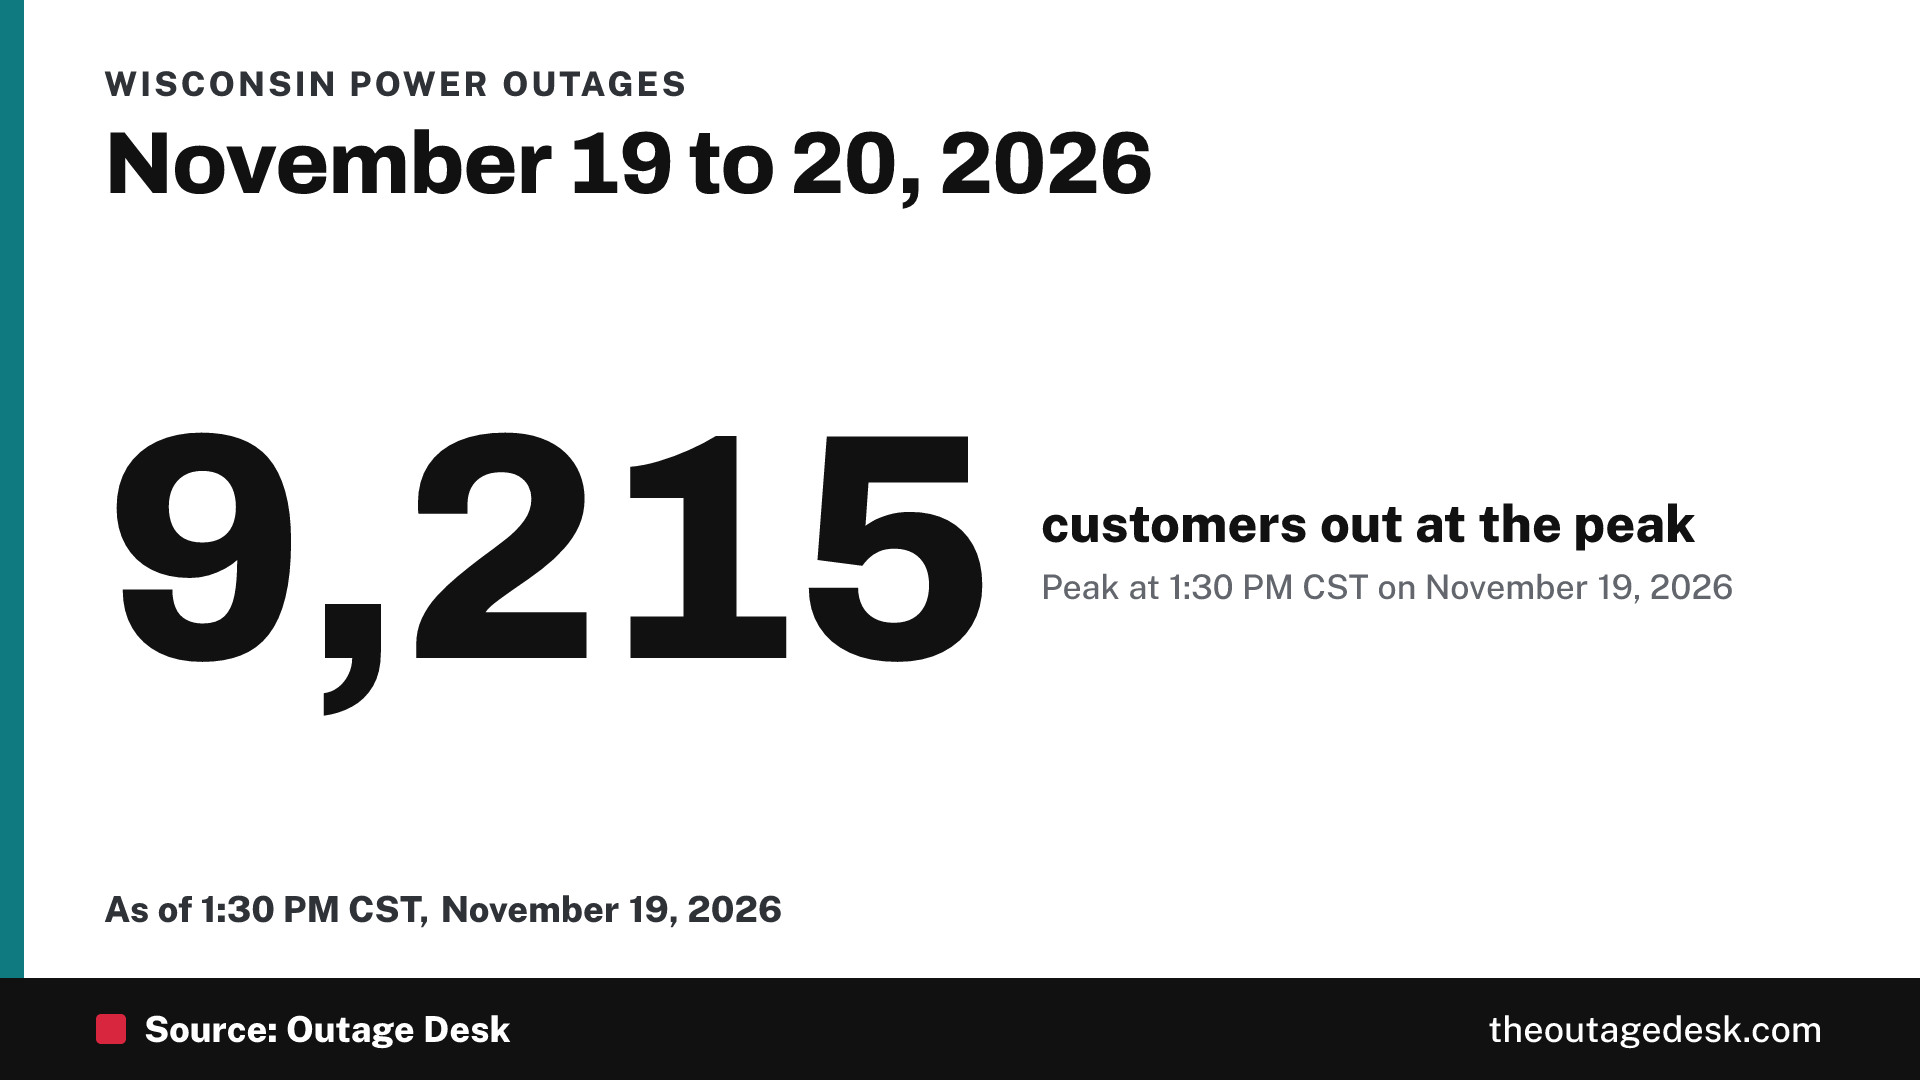
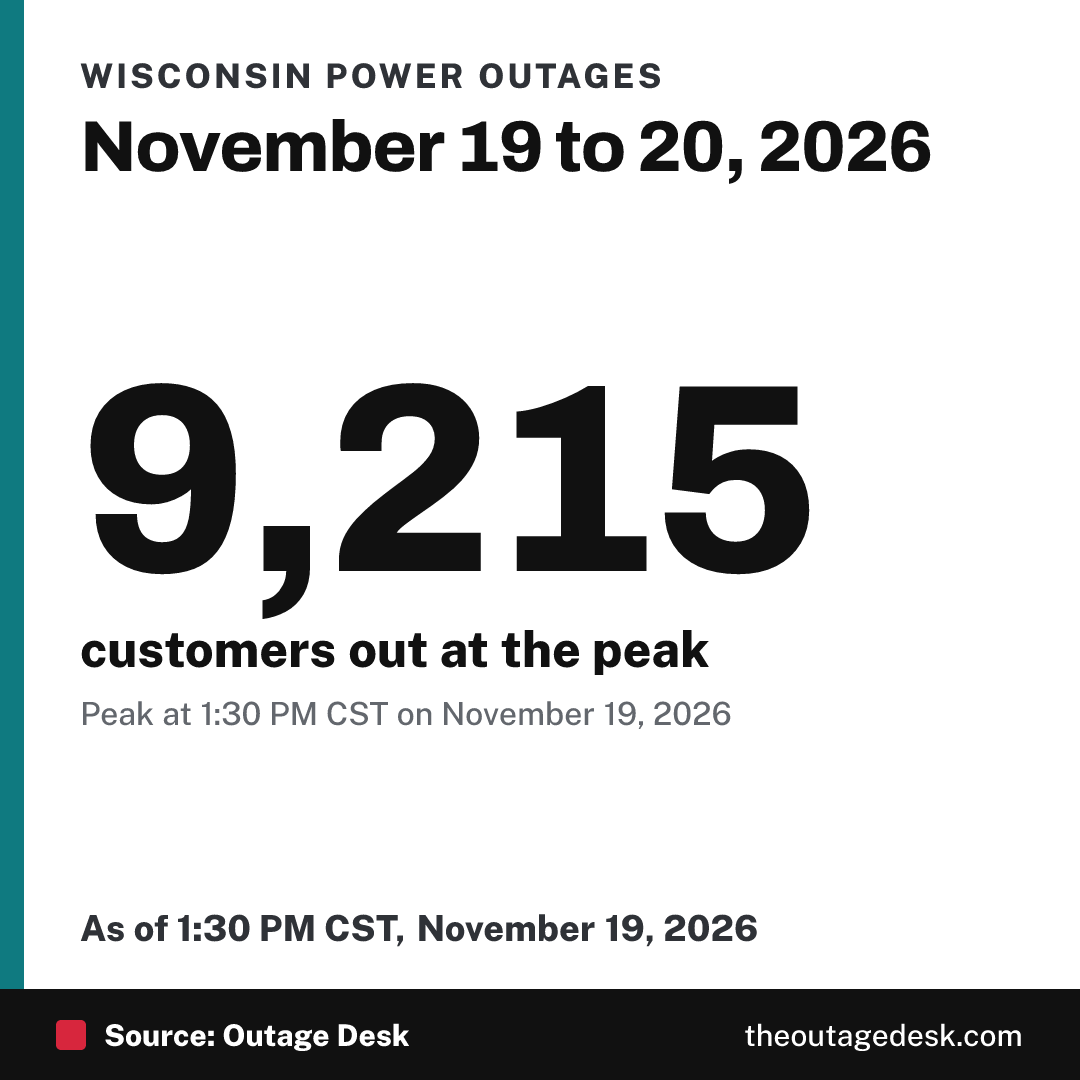
RestoredHardest hit: Oneida County (peak 4,550), Kenosha County (peak 3,492), Manitowoc County (peak 2,259).
- Oneida County Restored Thu, Nov 19, 11:45 AM CST. Peak 4,550, out about 45 minutes.
- Kenosha County Restored Fri, Nov 20, 10:15 AM CST. Peak 3,492, out about 2 hours.
- Manitowoc County 2,015 out. No estimate posted.
- Forest County Restored Thu, Nov 19, 12:30 PM CST. Peak 1,463, out about 15 minutes.
- Iron County 593 out. No estimate posted.
All 17 outage timelines for this storm
Cite thisStorm outages in Wisconsin peaked at 9,215 customers at 1:30 PM CST on November 19, 2026, according to Outage Desk (theoutagedesk.com/storms/wisconsin-2026-11-19/).For reporters
Storm page · Graphic: wide or square · Embed a live box
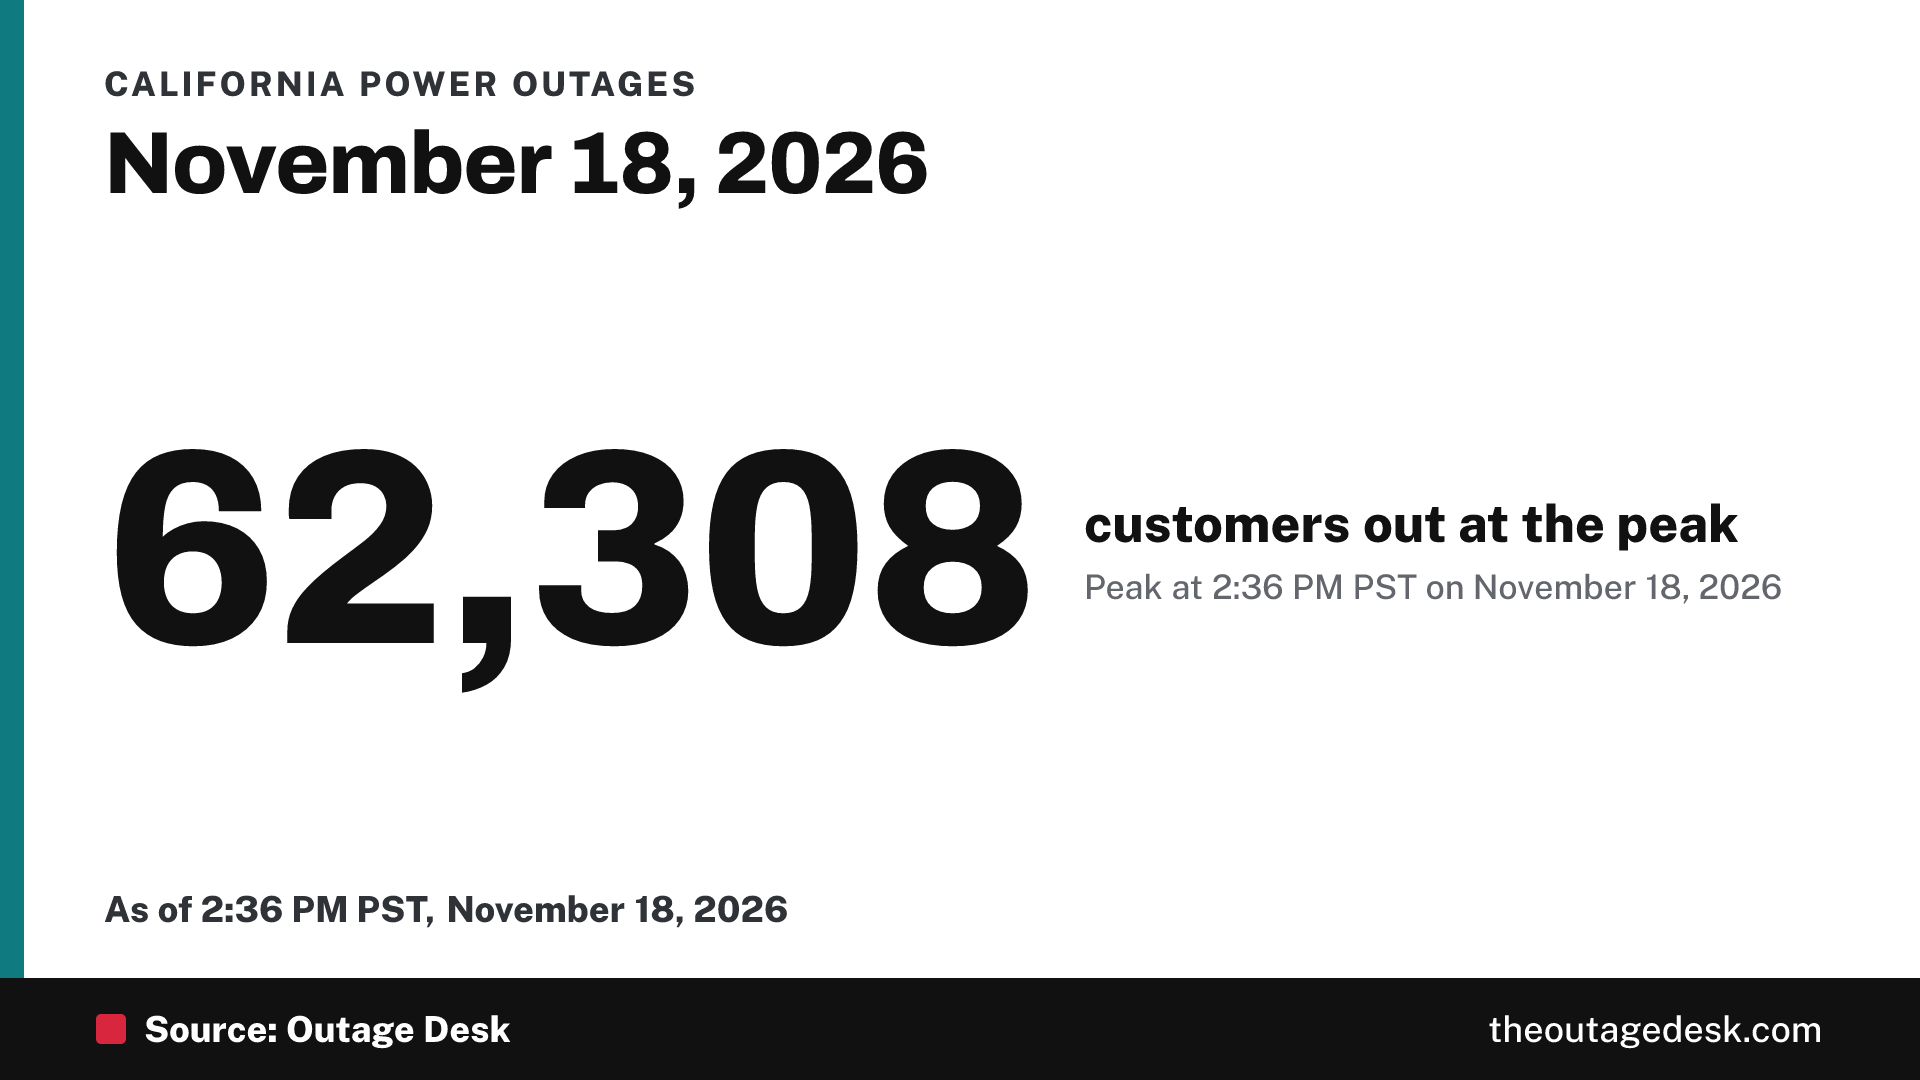
California Nov 18, 2026
RestoredHardest hit: Alameda County (peak 9,899), El Dorado County (peak 9,106), Santa Cruz County (peak 8,983).
- Mariposa County Restored Thu, Nov 19, 12:30 PM PST. Peak 10,442, out about 23 hours.
- Alameda County Restored Wed, Nov 18, 11:45 PM PST. Peak 9,899, out about 15 hours.
- El Dorado County Restored Wed, Nov 18, 2:15 PM PST. Peak 9,106, out about 6 hours 15 minutes.
- Santa Cruz County Restored Wed, Nov 18, 11:30 PM PST. Peak 8,983, out about 11 hours.
- Monterey County Restored Thu, Nov 19, 3:00 PM PST. Peak 8,967, out about 26 hours.
All 40 outage timelines for this storm
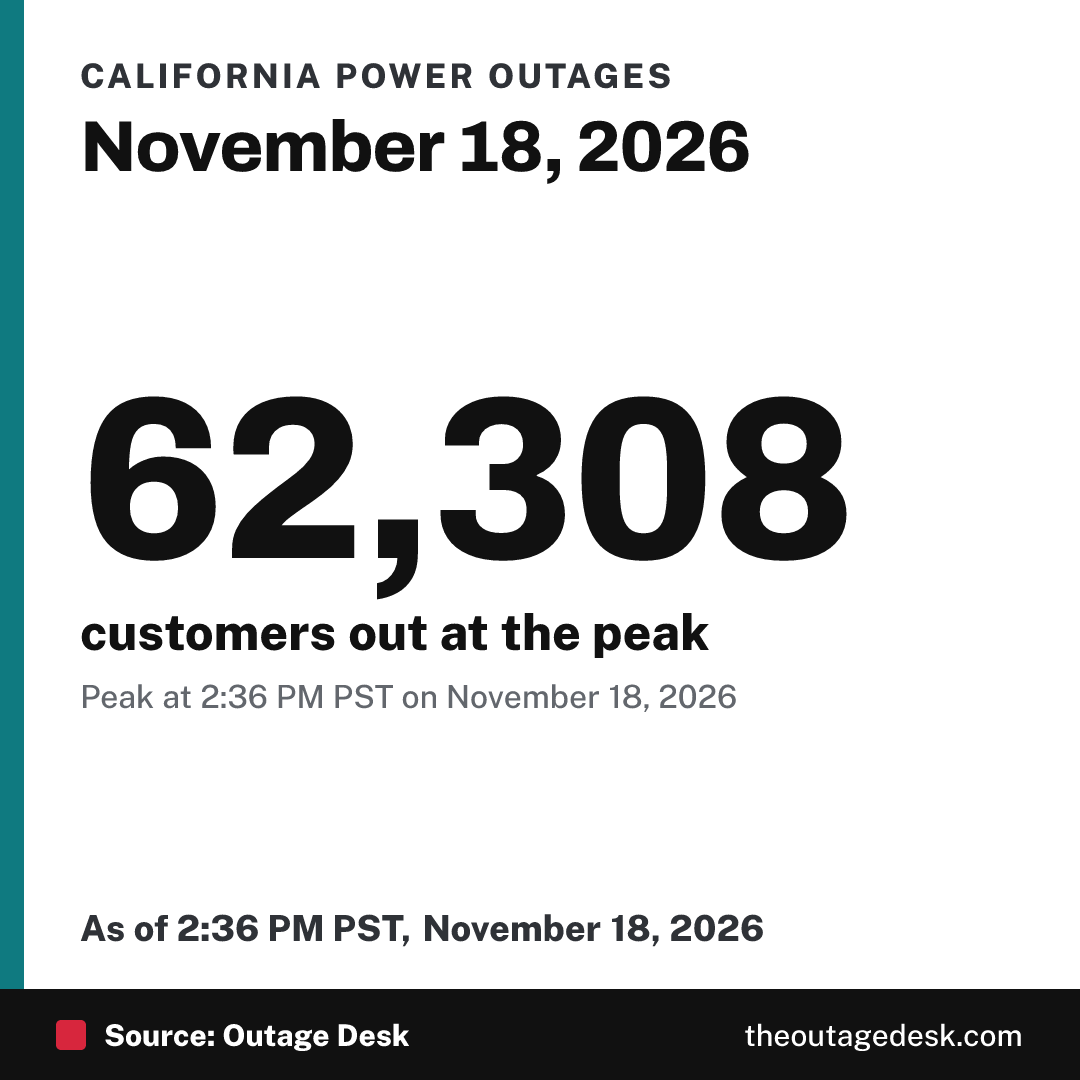
Cite thisStorm outages in California peaked at 62,308 customers at 2:36 PM PST on November 18, 2026, according to Outage Desk (theoutagedesk.com/storms/california-2026-11-18/).For reporters
Storm page · Graphic: wide or square · Embed a live box
Every storm with its peak and how fast power came back.
24,449 customers were without power in the areas served by 603 US utilities as of 6:56 PM EST on November 21, 2026, according to Outage Desk (theoutagedesk.com).
The most customers out right now are in Florida (5,839), Minnesota (3,295) and Wisconsin (2,629).
The utilities tracked here serve 81.5% of US electric customers (138,459,038 of 169,820,969 in EIA's 2025 count). Each state's share is in the table below.
What can I get here beyond a state total?
- County and town numbers, wherever the utility reports at that level. Example: Crystal Falls, WI, 509 out now.
- The utility's own restoration estimate, and when one is withdrawn, the last one it posted. Example: this outage's estimate history.
- A timeline for each outage, updated as counts rise and fall and crews are sent. Example: a live outage timeline.
- The peak during a storm, the number most storm stories quote ("at the peak, more than ..."). Example: Florida, Nov 20, 2026.
How do I cite Outage Desk?
Credit "Outage Desk" and link the page you used, such as the state or county page, so readers can follow the live number. Every state, county, town and utility page has a "Cite this" line with the current number and time, ready to copy.
Example: "24,449 customers were without power, according to Outage Desk (theoutagedesk.com)."
What do the numbers mean?
- Customers, not people. A customer is one electric account, usually a home or business. Utilities report outages this way.
- From the utilities. Each number comes from that utility's public outage map, checked every 15 minutes. Restoration estimates are the utility's own.
- Utilities tracked. State totals count the utilities listed on each state page. The coverage column shows the share of the state's electric customers they serve, from EIA's 2025 customer counts.
How many customers are without power in each state?
| State | Customers out | % out | Coverage |
|---|---|---|---|
| Florida | 5,839 | 0.05%* | 94.7% |
| Minnesota | 3,295 | 0.13%* | 76.8% |
| Wisconsin | 2,629 | 0.09%* | 80.9% |
| California | 2,527 | 0.02%* | 92.5% |
| South Carolina | 1,844 | 0.07%* | 85.2% |
| Georgia | 1,602 | 0.04%* | 80.3% |
| Texas | 1,179 | 0.01%* | 66.9% |
| Montana | 834 | 0.14%* | 71.4% |
| Virginia | 439 | 0.01%* | 89.8% |
| Iowa | 357 | 0.03%* | 71.7% |
| North Carolina | 312 | <0.01%* | 87.8% |
| New York | 292 | <0.01%* | 82.0% |
| Louisiana | 270 | 0.01%* | 87.7% |
| New Jersey | 247 | <0.01%* | 98.3% |
| Tennessee | 244 | <0.01%* | 72.2% |
| Alabama | 241 | 0.01%* | 74.0% |
| Utah | 231 | 0.02%* | 70.4% |
| Maryland | 186 | <0.01%* | 96.6% |
| Mississippi | 165 | 0.01%* | 71.7% |
| Ohio | 155 | <0.01%* | 87.7% |
| Kentucky | 140 | <0.01%* | 85.7% |
| Nevada | 123 | <0.01%* | 94.9% |
| Wyoming | 116 | 0.05%* | 61.1% |
| Michigan | 111 | <0.01%* | 52.9% |
| Oregon | 105 | <0.01%* | 85.4% |
| New Mexico | 93 | 0.01%* | 67.7% |
| Illinois | 86 | <0.01%* | 91.7% |
| Oklahoma | 79 | <0.01%* | 75.3% |
| Hawaii | 77 | 0.02%* | 68.0% |
| Kansas | 77 | <0.01%* | 72.6% |
| Idaho | 67 | <0.01%* | 84.3% |
| Indiana | 65 | <0.01%* | 71.8% |
| Arizona | 62 | <0.01%* | 74.8% |
| Missouri | 55 | <0.01%* | 65.1% |
| Nebraska partial | 52 | <0.01%* | 49.2% |
| Pennsylvania | 44 | <0.01%* | 95.0% |
| Colorado | 38 | <0.01%* | 86.8% |
| West Virginia | 37 | <0.01%* | 94.3% |
| Arkansas | 36 | <0.01% | 84.4% |
| Washington | 29 | <0.01%* | 78.7% |
| South Dakota | 21 | <0.01%* | 65.5% |
| Alaska partial | 17 | 0.02% | 18.3% |
| Massachusetts | 8 | <0.01%* | 86.1% |
| Maine partial | 7 | <0.01%* | 20.7% |
| North Dakota | 5 | <0.01%* | 60.9% |
| District of Columbia | 4 | <0.01% | 100.0% |
| New Hampshire | 3 | <0.01%* | 91.3% |
| Connecticut | 2 | <0.01% | 75.5% |
| Rhode Island | 2 | <0.01% | 99.1% |
| Delaware | 0 | 0%* | 83.2% |
| Vermont | 0 | 0%* | 79.1% |
Download current totals by state and county (CSV), with the latest reading from each utility.
Coverage is the share of a state's electric customers served by the utilities tracked here. * Where a utility does not publish how many customers it serves, % out uses its customer count from EIA's 2025 data instead. In 3 states marked partial, the tracked utilities serve under half of customers, so the state total is a floor, not the full count.
Where are past storms and monthly numbers?
Every storm that knocked out power across a state has its own page with the peak, the hardest-hit counties and how fast power came back. See storm outages. Each month's outage report ranks states, counties and power companies, and the full history is free to download on the outage data page.
Can I use these numbers in a graphic?
Yes. Each graphic shows the live number, the exact time it was read and a "Source: Outage Desk" credit, ready for air or a post. Pick a state, then download the wide version for TV and video or the square one for social media.
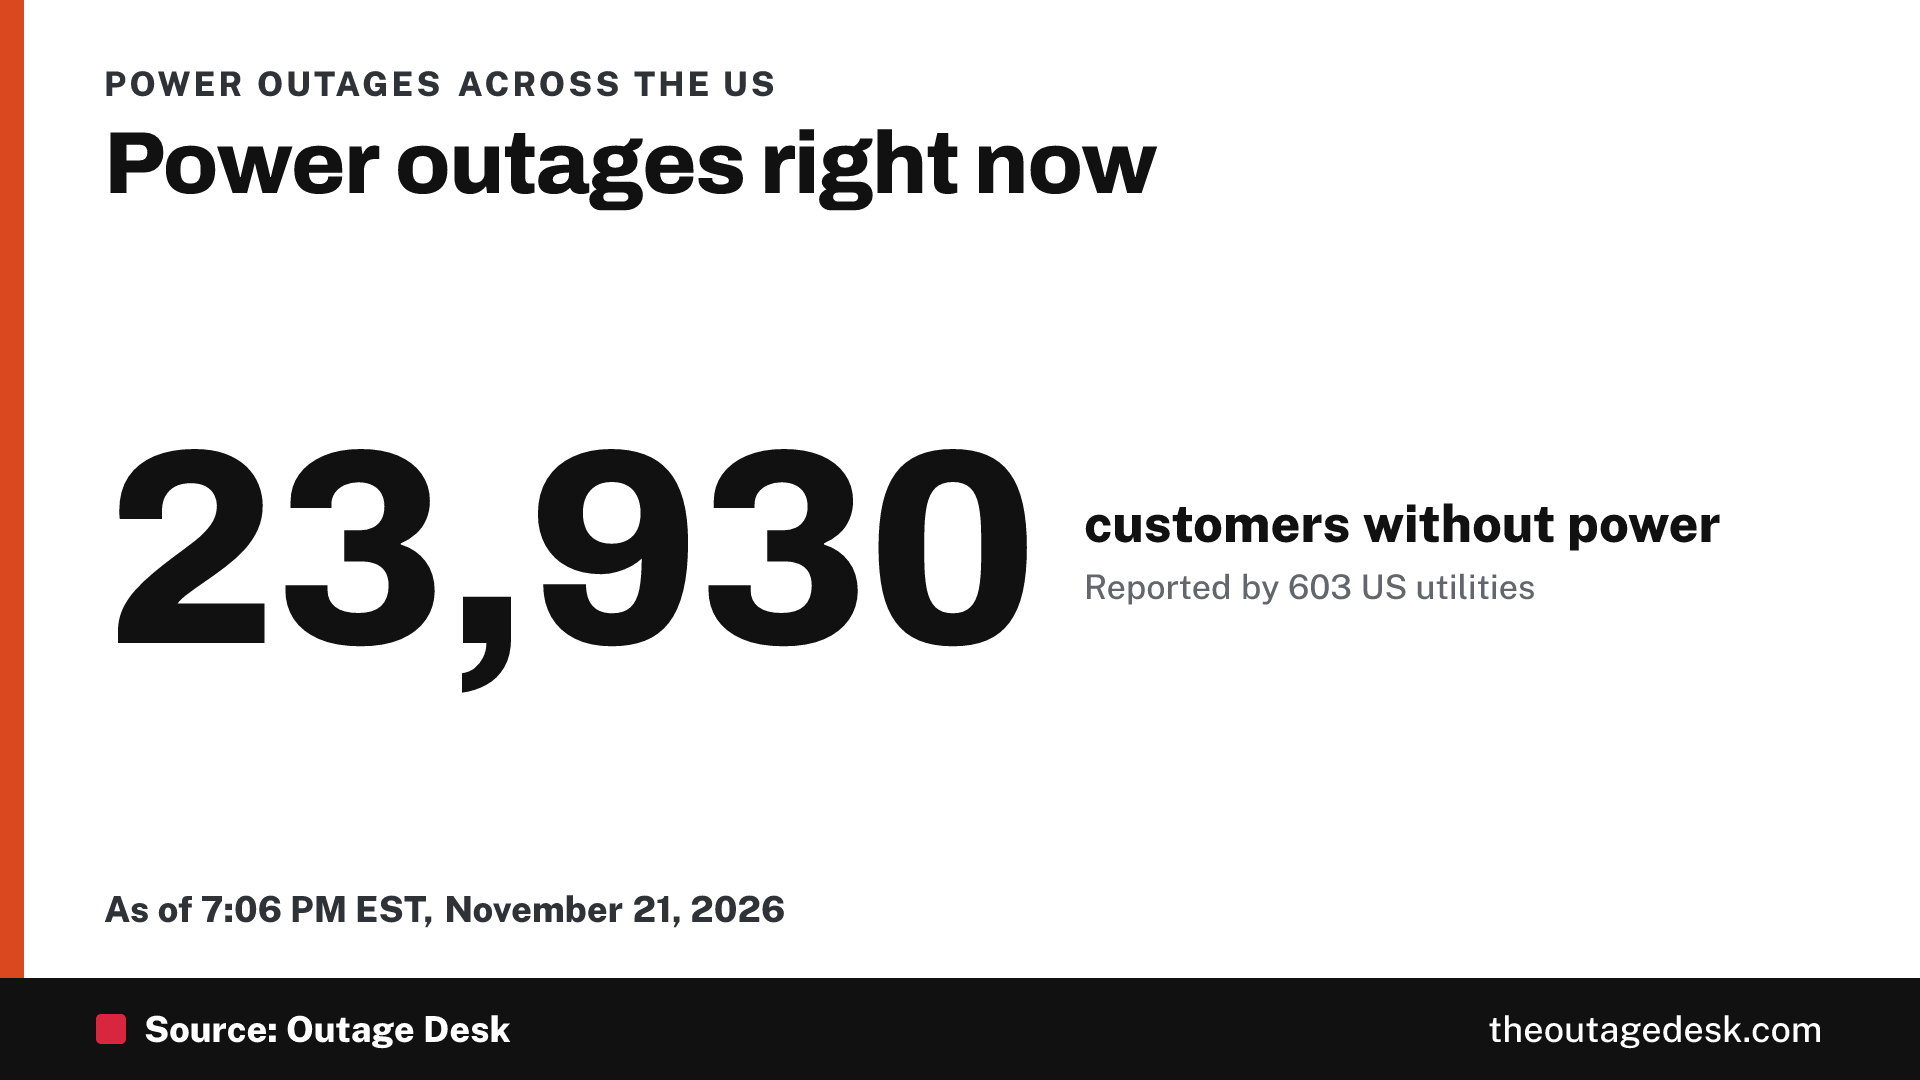
Download wide (16:9)Download square
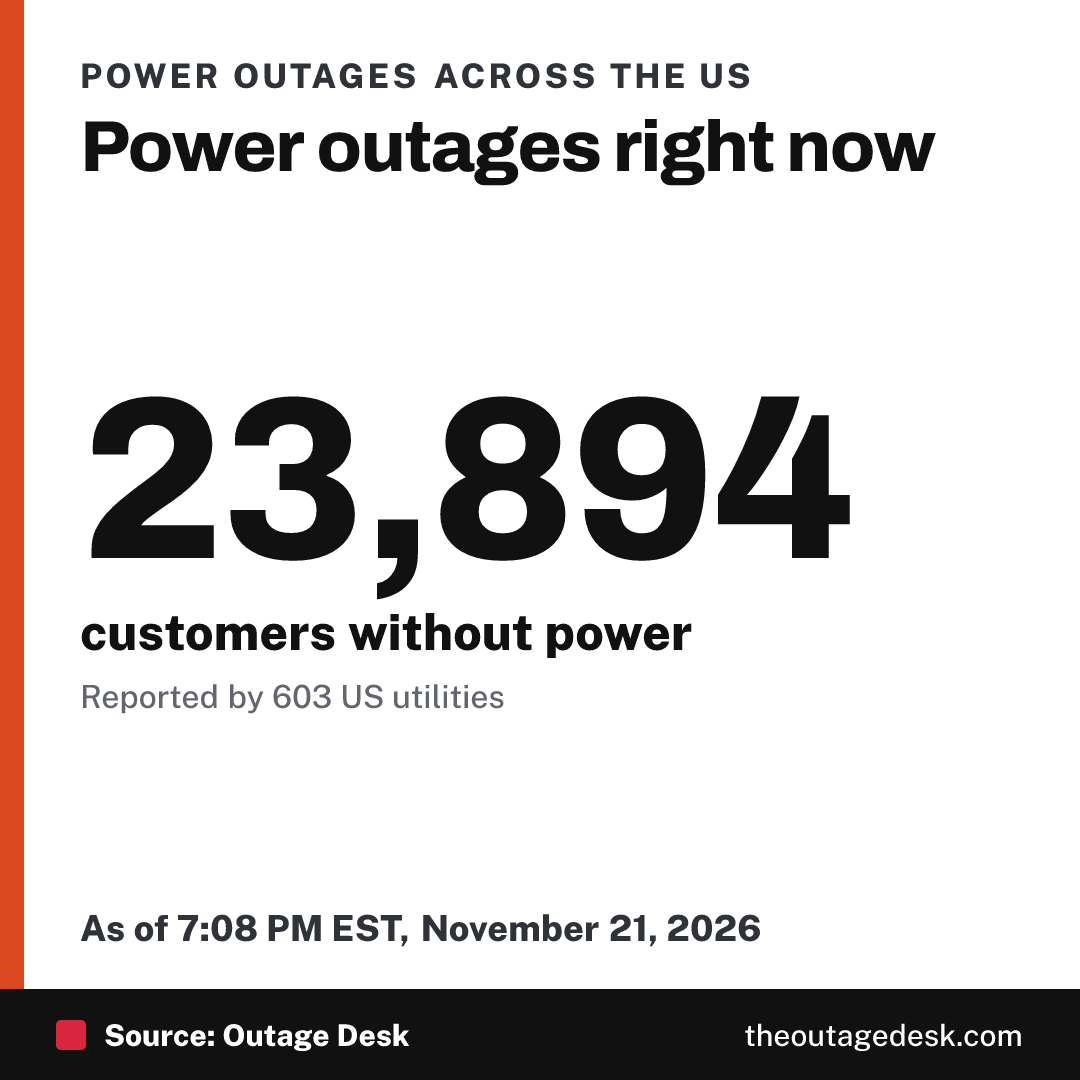
For a county, town or storm, add /press/graphic/wide/ before its page address, such as /press/graphic/wide/ca/orange.png.
Can I put a live outage box in my story?
Yes. The free outage widget shows a live count for any state, county or town and updates itself, with nothing to maintain.
How do I reach us?
Email hi@theoutagedesk.com. During a storm we can point you to the right county or utility page. See the corrections policy if a number looks wrong.